This is the Autochart Live Chart Live chapter from the new Doctor Sonar Helix training DVD to released in a few months. Once you use Autochart Live you will be hooked!
Watch Video
Finding fish with side imaging is difficult for most anglers since we don’t have enough screens on the boat. We tend to select map, sonar and Down Imaging and forget about the side imaging, but finding fish is easy if you have the right conditions. One of the problems we run into is that a rocky bottom reflects so much of the sonar it’s bright and fish show up as bright areas which means there is little contrast and they are easily hidden, while softer bottoms show up darker so fish really show up in this image.
Notice all the fish on the right on the first image.

I usually leave my unit on 455 kHz since you get much more range than with 800 kHz.
The next image shows larger fish in the red circle and smaller fish in the green circles. Notice the depth is 3.7 ft.

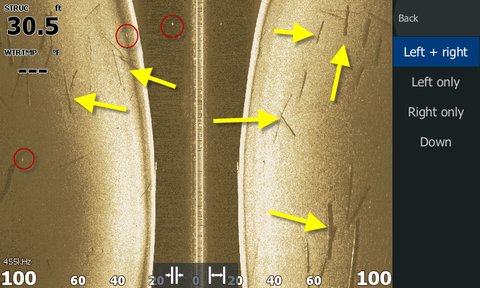
But don’t be fooled by logs on the bottom left over from the timber logging industry.
Yellow arrows are pointing out the logs.
The red circles are around fish which show up as white dots.
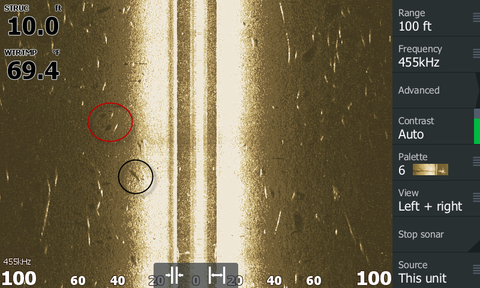
The next image has more fish that are longer. Here we need to remember the length of the fish is dependent on boat speed. The faster the boat travels the fewer sonar pings that are going to cover the fish so their length will show up shorter.
Another good way for identifying fish is the shadow the fish cast, the farther away the shadow is from the fish the higher in the water column the fish is located.
The red and black circles show fish and shadows. The fish nearer the center are harder to see since the bottom is brighter nearer the center so the shadow becomes helpful in identifying the fish.
Interpreting sonar, down imaging and side imaging is very difficult. I have 3 great images to use as examples for teaching interpretation of sonar.
The left side imaging is showing the drop-off as dark (yellow arrows point to the drop-off on the map and side image). Bright is the strongest return and black is none. Since sound goes in a straight line the drop-off is dark.
The red circle is showing fish on the shallow side and I think they are about where the red arrow is pointing on the map. I would mark a waypoint on the side image and cast to the fish since they are shallow. Notice the boat is in 2.9 feet.

The next image shows the drop-off as dark (red circle) and fish are suspended near the drop (yellow arrow). Fish show up well on side imaging since they show up as bright on the dark background. Hard bottom is also bright which makes fish difficult to see on bright background.

This is an amazingly clear image of boulders (green arrow) next to trees (yellow arrow) that slid from the bank into the river.
The red arrow shows a fish in the trees and the white arrow shows a small drop-off.

Don’t miss supper, get better at sonar and fish where there are fish. Use the splitscreen sonar and down imaging and compare the two and you will become an expert.
Down imaging has a narrow wide cone and the 2D sonar has a round cone so they view targets differently and comparing the two makes interpreting sonar much easier.
This image is showing trees and the 2D sonar on the left is difficult to interpret but the down imaging shows the trees well.
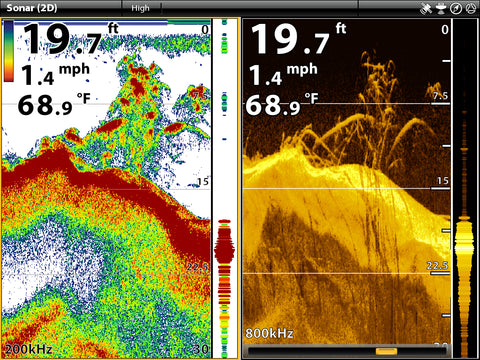
This image shows fish on the side of a boulder but the down imaging shows 2 fish and I get much more excited seeing two fish than one.
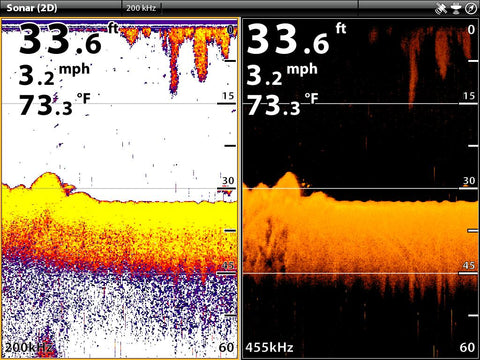
This image shows 2 bait balls in weeds (yellow and green arrows) that the 2D sonar looks like weeds.
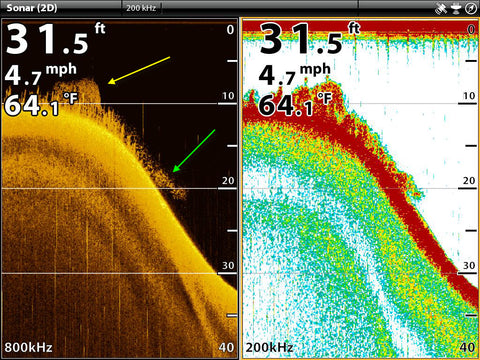
This image looks like stacked fish because of the arches but it is a common when you have posts or trees.
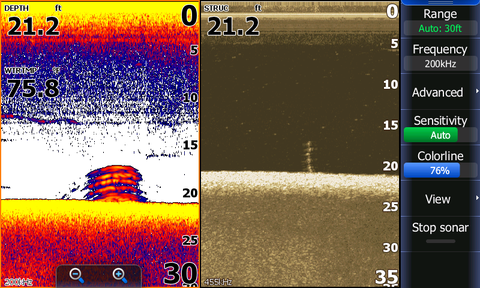
On this image the bait ball and the larger fish near it are missed with 2d sonar.
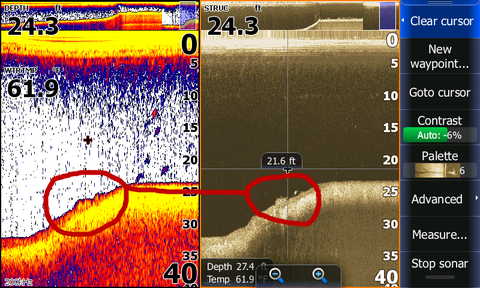
I see images like these everyday on the water since I usually run down imaging with 2d sonar. If you miss a fish on sonar you may miss supper.
From Johnnie Candle pro walleye angler and full time guide on Devils Lake.
I use this method to target individual fish using the I Pilot link to a Humminbird Core model, Helix or ONIX. I Pilot Link makes fishing for individual fish incredibly easy. When graphing a location, I will have my trolling motor in the water. With the new Ulterra, I don’t even have to get out of my seat to do this. I will have my Helix or ONIX in split screen mode with the active side being the sonar side or just the sonar screen. If I mark a fish that I want to target, I will place the cursor over that fish and create a waypoint.

Stop the boat, then using the menu or the touch screen to spot lock on that waypoint from your Humminbird. As the boat drives itself to that waypoint, I have time to grab my fishing rod and be ready to fish when the boat arrives to that fish. It is amazing how many times you will catch that fish.
Sonar Training Humminbird Snapshot
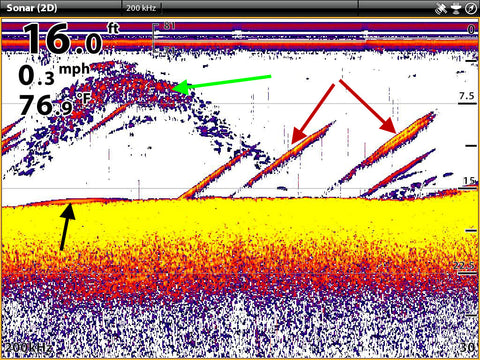
Black arrow is a fish close to the bottom
Red arrows are air bubbles
Green arrow is bait or fish on edge of sonar cone
Fish close to the bottom display as bumps on the bottom.
Air bubbles are caused by decaying matter at the bottom and show up as diagonal lines.
Bait or fish on the edge of the cone display as blurry and not dense with unusual looking arches.
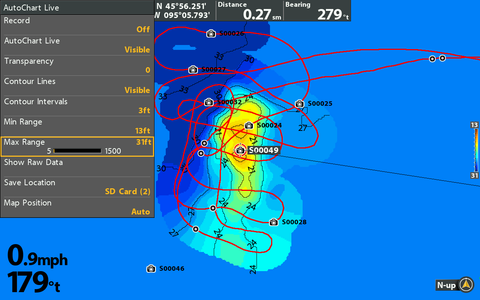
Since I now live on a lake I decided to map it with AutoChart Live on my Humminbird ONIX. I use a zero lines SD card to record the data to since at the present time if you record to the internal memory you can’t get the data exported.
I started mapping the closest area before I went out fishing and mapping.
This image is showing the start of the mapping. The single colored bands are one pass.

Notice the improvement as I collect more data.

I used to do this with DrDepth and my laptop but using AutoChart Live is much easier.
I have found a few spots not on the regular Navionics and Lowrance map chips and I plan to keep this map just for me since I like eating fish and secret spots are a treasure to be protected for my family.
I suspect it will take all year to map the lake accurately since I stop to fish since fishing is more important than mapping.
The process is very easy, press menu and select AutoChart Live, and this menu allows you to select record which starts the process and make sure you have the AutoChart Live box checked.
Notice the Save Location box, you select this and I recommend using a AutoChart zero line card to record instead of the internal memory so you have your recorded data for later use. The internal memory only allows 8 hours of recording time.

This is not a toy but an important fishing tool for structure fishermen.
Do you think this is a good spot to fish? Make a guess what you see, I am fishing vertical in waves so everything is wavy looking. The screenshots are from Humminbird ONIX with the all in one transducer using 200 kHz. The Lowrance Gen 3 is using the Airmar TM150 transducer on fixed frequency 145 kHz. I run both at the same time for comparison and if I see a fish on just one transducer I know which side of the boat it is on!!!!


I was fishing weeds like these since all kinds of fish like emerging weeds.
I tried slip bobbers, jigs and rigs with no bites so my friend and I took a look with my AV Multi-Vu Complete Camera System which has no screen but a plugs into my Lowrance Gen 3 and I use it as the screen.

Well, I was wrong again! I thought I was seeing fish in the weeds but I looked for a long time and never saw a fish but saw many tall weeds lying horizontal so the sonar did not show the weeds as attached to the bottom and they then looked like fish to me. I have said for years the best use of a camera in the boat is if you see fish and can’t get them to bite look with the camera to confirm if you are reading your sonar correct. Many times the fish are the wrong species and like this time unusual weeds.

DownScan Interpretation
This explanation is to help explain what you see with down imaging, it is pertinent to all brand’s down imaging.
Down imaging has a wider cone and will show targets off the side better than the 2D sonar (traditional sonar 200 kHz).
Notice the man-made structure plus the rocks.
Sonar tells us the distance to the target. The man-made structure pointed out with the white arrow is 8 feet from the transducer. How about the red arrow? It is pointing at rocks and long strips of something man-made. You can’t tell which side it is on since the left and right edge of the cone is combined, something 12 feet from the transducer on the left with be superimposed on something 12 feet from the transducer on the right side.

If you have side scan you can see which side of the boat a target is.
Notice the rocks are opposite the man-made structure but on the DownScan they are overlapped.

The next example shows fish by a tree on DownScan and the side scan shows the same fish to the left side. The problem is we don’t have enough screens to show all we want. I like to see the map, 2D sonar, down imaging and side scan and that is a lot of dash space to be used. The fish and the tree look like white spots and are hard to interpret. I like one model with splitscreen sonar and DownScan and one splitscreen map and side scan with the side scan using 2/3 of the screen since wide screens are best for side scan like I used 2/3 for sides can in the image.

Johnnie Candle review of the Humminbird ONIX after using it last summer.

Read More >>


