Side scan saved the day. the weed, sand and mud edges were easily seen. The little sand dip in the weeds is where we found walleyes. They were on the sand right next to the weeds.
No wind, clear water and sunny. Only bass shallow so we looked deeper and found some at 22 foot.
Top arrow is mud
2nd arrow is sand
3rd arrow is weedlines
Bottom arrow is weed dip

We were using spot lock to cast for walleye and Levi said look at the sonar. I quickly reeled up and dropped my jig and caught a 4 lb largemouth bass. The 2nd photo is the bass swimming away after I released it.

Notice the 2 bright yellow arches (green arrow) in the red bait (black)

I looked at lots of areas and didn't see any fish and caught fish. But here is one example where the fish showed up.

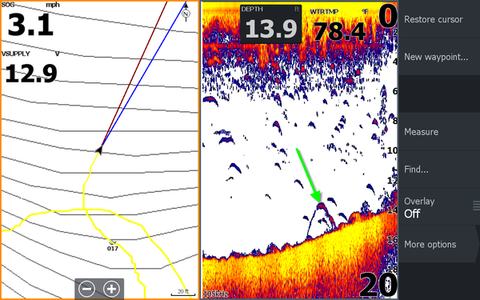
Fish in vegetation, you don't have to see fish to catch them. I often don't mark fish in weeds but still catch them like this one. I spotted the fish with my Aqua-Vu and dropped my bait near the camera!


Green arrow shows nice fish on down imaging but looks small on 2D. It is probably on the edge of the 2D cone and the DI cone is wider so shows the fish better.
Reason to run DI and 2D sonar. I also use Navionics on my Lowrance and LakeMaster on my Humminbird. DI (down imaging) is better in weeds most of the time.

My Garmin PS30 shows the distance to the side the fish are.
Green arrow 3 feet to the left of the transducer which is mounted on boat's mid-line.
White arrow 8 feet to left.
2D sonar only tells you how far off the bottom and that the fish in the cone somewhere.


#6
Red circle fish
Black arrow weeds
Green arrow small boulders on hard bottom point.
Blue arrow bait balls that create shadows on side scan.

This should help get started in interpreting your sonar.
Using sonar, down imaging, Lowrance, Humminbird, and Aqua-Vu to study fish
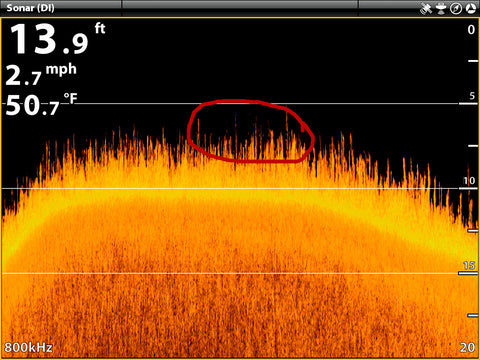
Just another example on why down imaging helps sonar interpretation. The weeds look similar to fish.
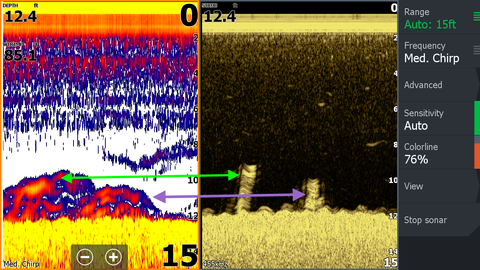
In this one the fish look like weeds.
Identifying fish size on sonar is very difficult since you can change the size with sensitivity adjustments or depth range. Fish look larger on a depth range of 20 foot than 100 foot. The size of a fish is determined by the color of the fish arch. For example if you have palette colors yellow, blue and red. The more yellow you see the bigger the fish. The thickness of the fish arch also determines fish size. How long the fish arch is just how long the fish is below the transducer.
In the image the black vertical lines show how long the fish is under the transducer and the green lines show the thickness of the fish arch.
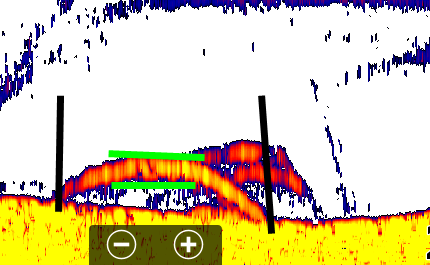
The best way to tell size is catch one the fish you see on sonar or use an Aqua-Vu camera.
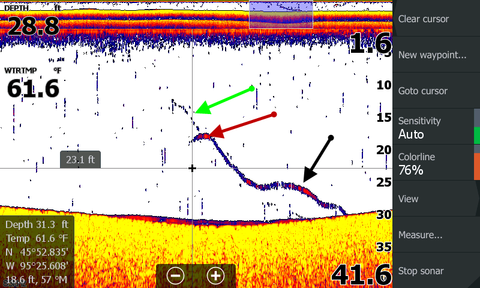
The first example shows my bait dropping (green arrow), the bait is intercepted by a bass (red arrow) and the bass swims to the bottom (black arrow) and then I set the hook and catch him.
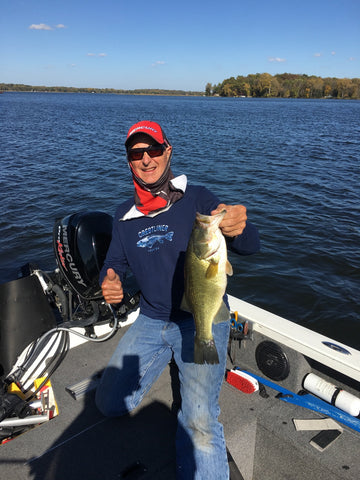
This is the bass.
How about these fish. Needless to say I was excited when I found them but they didn't bite so I dropped the Aqua-Vu camera and was surprised what I found.
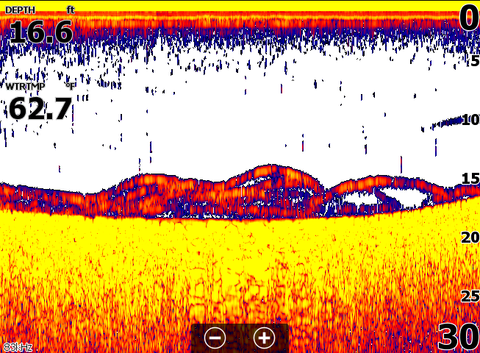
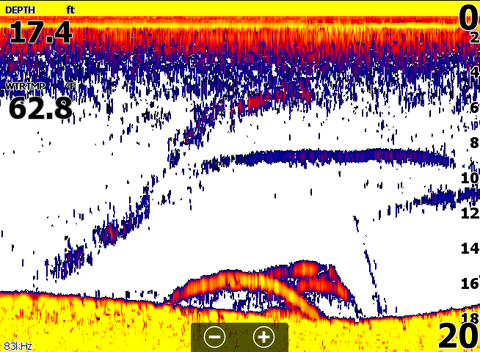
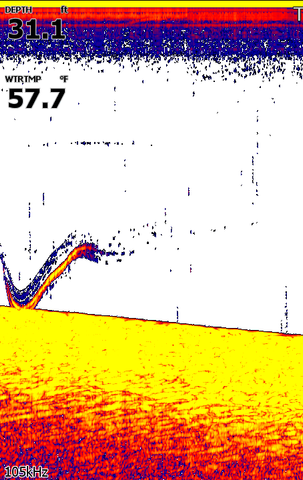
On this screenshot is a 7.5 lb. northern pike, you can see when I set the hook and started bringing him to the surface.
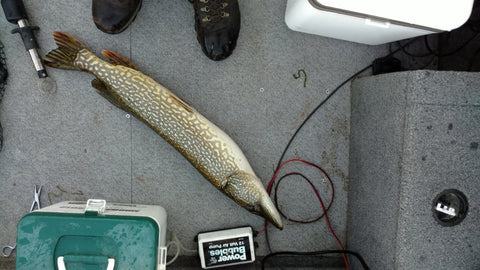
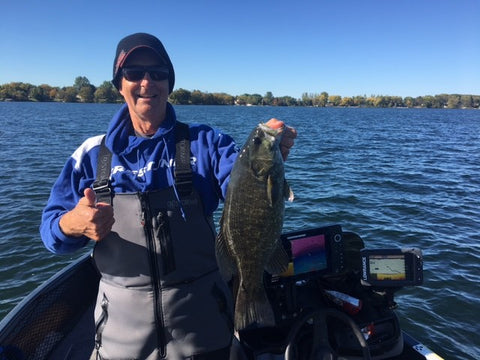
The last screenshot is smallmouth bass and I caught a few, this is a picture of one of them. One of my favorite fish to catch.

This screenshot shows a 29.5 inch walleye after being released.
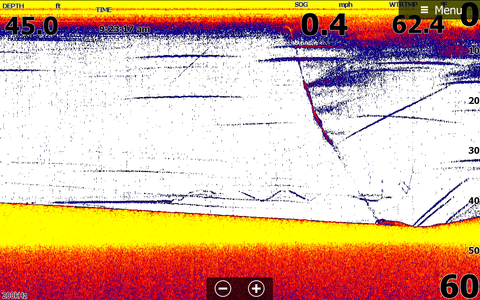
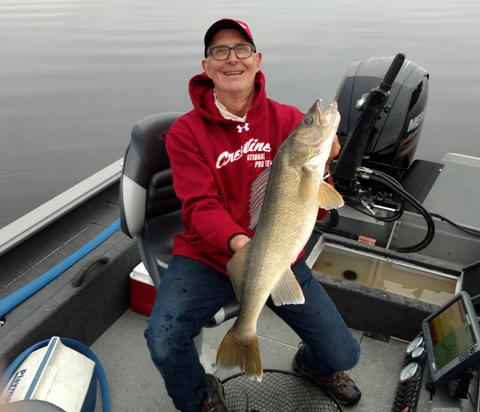
I was lucky in my timing to collect good data to prove fish size on sonar.
Last but not least is what a 5 inch minnow attached to a sinker looks like with 1.5-2.5 lb. walleyes below it.
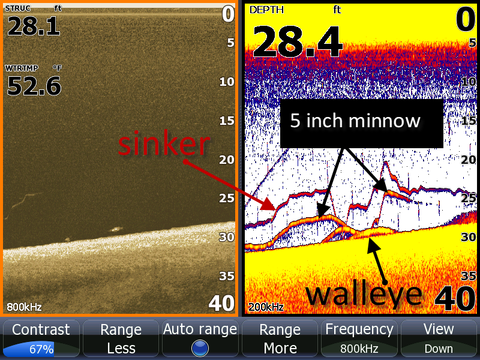
Learn how crappies display on different sonar brands.
Crappies are a much sought after fish and I get a lot of questions about what they look like on sonar. Crappies often suspend over open water, making them difficult to target. In this session I will show what they look like on different sonar brands.
Image #1 shows crappies on a 2D Garmin sonar using High Chirp.

Image #2 shows the same school with a Humminbird using the MEGA transducer on High Chirp.
Image #3 is the same school using a Lowrance TM150 transducer set at 105 kHz frequency.
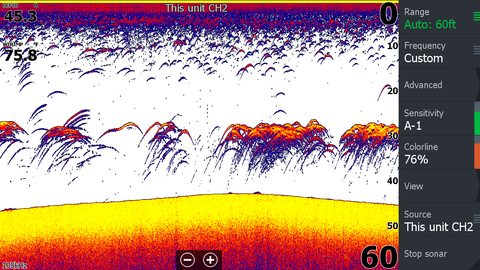
Image #4 shows the same school with the Humminbird side imaging
Next are 2 videos showing the Panoptix with 2 different transducers. The PS 30 looks down and to the side and the PS 21 looks to the side.
I use side imaging or the PS 21 to find the school when it moves since they see to the side and I use Minn Kota Spot Lock to sit on the school and vertically jig for supper.
Watch the short video to get an understanding why weeds are important for fishing.
Ever wonder what to do when you are slowly moving jig or rig fishing and lose the fish on sonar?
I had these fish near weeds located with down sonar (2D and down imaging).


If they disappear I look at the side imaging on a different screen to see if they are left or right. Like this image.
I place the cursor on the fish on the side imaging and create a waypoint and then move the boat to the fish before they move too far. It is easy, once you catch a few fish this way you add it to your fishing tools.

Understanding bottom hardness is vital to understanding and catching walleyes.
Sometimes it is easy like this image with the hard bottom on the left.
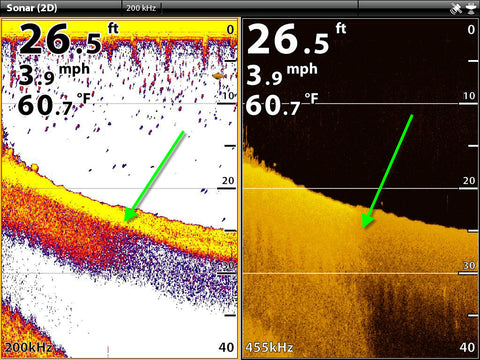
I use Auto-sensitivity on my Humminbird and Lowrance models almost always. It works so well we never notice when it adjusts. Auto-Sensitivity mainly adjusts for depth. We need a higher sensitivity in deeper water since the sound that returns as you go deeper becomes weaker. A manual setting of sensitivity for 10 feet to get the optimal image would not show fish at 100 feet and this is where Auto-Sensitivity shines.
I’ll use examples from this summer when there were a lot of microorganisms in the water so you see a funny screen to help understand what is happening when the auto-sensitivity is working.
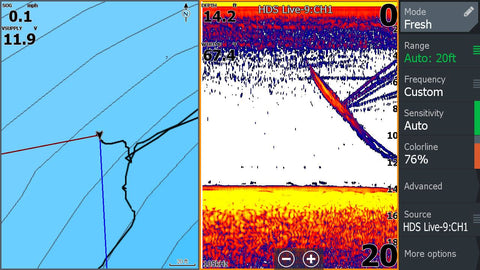
The first image shows rapid depth changes at a speed of 30 mph. Notice the clutter clears when I go shallow (green arrows).
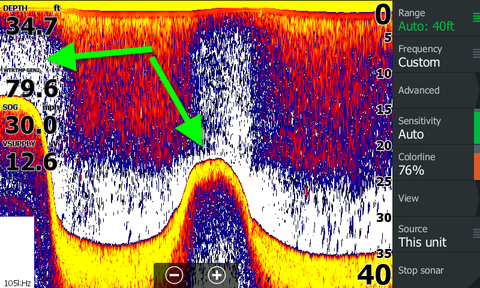
The next image shows the suspended clutter change as I go up the slope. At the same time as the clutter changes, the bottom changes (green arrow). The Auto-Sensitivity has decreased the sensitivity at a certain depth. It is important to understand this when you are trying to determine bottom hardness as walleyes are often found by finding hard bottom.
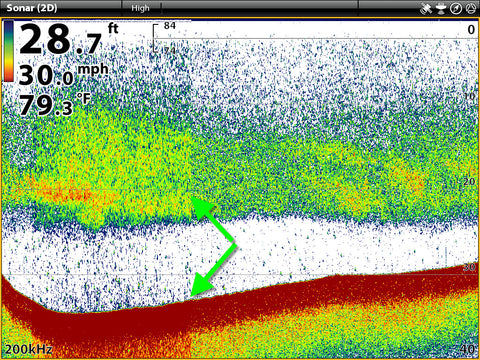
The 3rd image shows what appears to be harder bottom on the right side of the image but this is caused mainly by the Auto-Sensitivity increasing the sensitivity as I go deeper (green arrow).
Harder bottom has a wider bottom band and stronger colors like the yellow. It is easily to fooled by this image and think there is a transition from soft to hard bottom which walleyes often prefer.
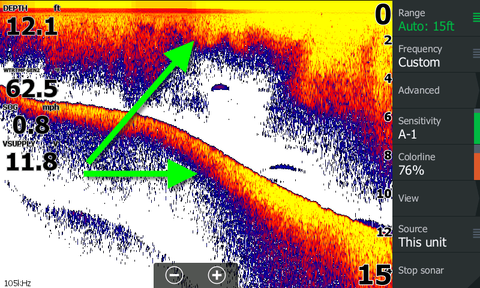
Auto-Sensitivity is a great feature but understanding its limitations is important for hunting hard bottom which can result in you greasing the pan for walleye more often.
Interpreting sonar, down imaging and side imaging is very difficult. I have 3 great images to use as examples for teaching interpretation of sonar.
The left side imaging is showing the drop-off as dark (yellow arrows point to the drop-off on the map and side image). Bright is the strongest return and black is none. Since sound goes in a straight line the drop-off is dark.
The red circle is showing fish on the shallow side and I think they are about where the red arrow is pointing on the map. I would mark a waypoint on the side image and cast to the fish since they are shallow. Notice the boat is in 2.9 feet.

The next image shows the drop-off as dark (red circle) and fish are suspended near the drop (yellow arrow). Fish show up well on side imaging since they show up as bright on the dark background. Hard bottom is also bright which makes fish difficult to see on bright background.

This is an amazingly clear image of boulders (green arrow) next to trees (yellow arrow) that slid from the bank into the river.
The red arrow shows a fish in the trees and the white arrow shows a small drop-off.
