3D StructureScan Reviews Posted on February 15, 2017
The first 2 discussions will be my pro staff reviews and the last discussion will be Doctor Sonar's suggestions for interpretation and settings.
I produced this short video using sonar, down imaging and an Aqua-Vu to show you how I interpret sonar.
Click on image to view video
The first 2 discussions will be my pro staff reviews and the last discussion will be Doctor Sonar's suggestions for interpretation and settings.
It’s that time of the year, many are getting a new boat with electronics or are outfitting an existing boat with new electronics. Here are some things to think about when looking at purchasing new electronics. Use this as a checklist to help you make a educated decision.
And a few install tips are also thrown in.
Sorry, but it doesn’t work well. We can only make educated guesses.
I was looking for walleyes in the fall and noticed these nice fish at the depth I fish plus they were close to the bottom which is typical for walleyes.


But you bass anglers should read this tutorial so you can catch more fish.
I used small minnows and didn’t get bit so I up-sized to giant chubs (7 inches) and bass anglers know how much smallmouth love big minnows and I got bit. My Go Pro works well for selfies.
I decided to put down the camera to see if any walleye were mixed in and nope, just lots of bass. So, I smoked them and released them so someone else can have the same pleasure.
Just another reminder to not speed down the lake to the "next hotspot". I usually keep the boat at 20-24 mph and pay attention to the sonar because fish will show up in places that I don't suspect. Rule of thumb for walleyes is they don't follow the rules.
I was traveling at about 22 mph when these fish showed up on a drop and slowed to 3.7 mph. Notice the cursor is on the fish. I marked a waypoint and caught supper. I caught the walleye near the bottom and I am not sure what the suspended fish were since they didn't bite. They could have been walleye.

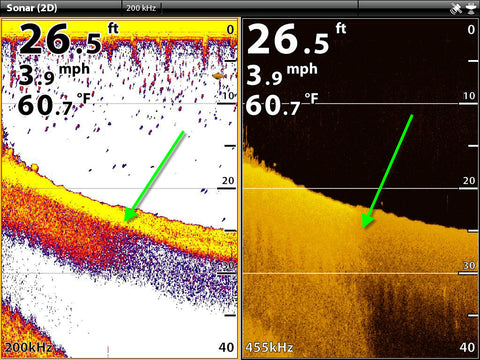
Understanding bottom hardness is vital to understanding and catching walleyes.
Sometimes it is easy like this image with the hard bottom on the left.
I use Auto-sensitivity on my Humminbird and Lowrance models almost always. It works so well we never notice when it adjusts. Auto-Sensitivity mainly adjusts for depth. We need a higher sensitivity in deeper water since the sound that returns as you go deeper becomes weaker. A manual setting of sensitivity for 10 feet to get the optimal image would not show fish at 100 feet and this is where Auto-Sensitivity shines.
I’ll use examples from this summer when there were a lot of microorganisms in the water so you see a funny screen to help understand what is happening when the auto-sensitivity is working.
The first image shows rapid depth changes at a speed of 30 mph. Notice the clutter clears when I go shallow (green arrows).
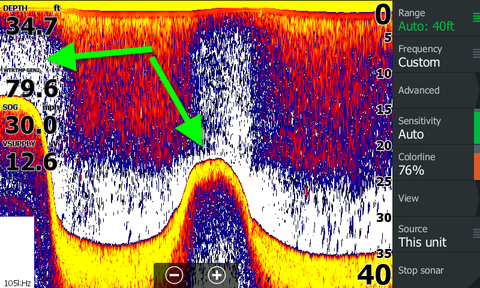
The next image shows the suspended clutter change as I go up the slope. At the same time as the clutter changes, the bottom changes (green arrow). The Auto-Sensitivity has decreased the sensitivity at a certain depth. It is important to understand this when you are trying to determine bottom hardness as walleyes are often found by finding hard bottom.
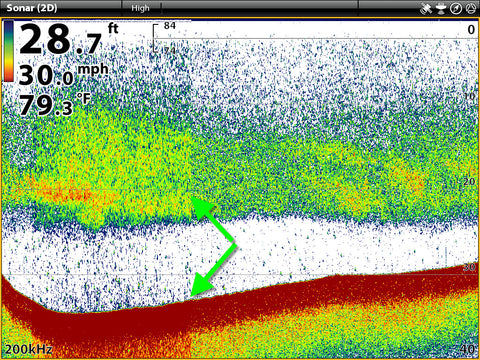
The 3rd image shows what appears to be harder bottom on the right side of the image but this is caused mainly by the Auto-Sensitivity increasing the sensitivity as I go deeper (green arrow).
Harder bottom has a wider bottom band and stronger colors like the yellow. It is easily to fooled by this image and think there is a transition from soft to hard bottom which walleyes often prefer.
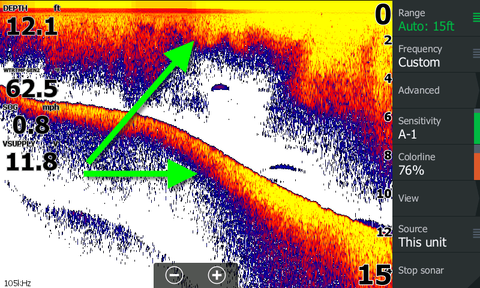
Auto-Sensitivity is a great feature but understanding its limitations is important for hunting hard bottom which can result in you greasing the pan for walleye more often.
Finding fish with side imaging is difficult for most anglers since we don’t have enough screens on the boat. We tend to select map, sonar and Down Imaging and forget about the side imaging, but finding fish is easy if you have the right conditions. One of the problems we run into is that a rocky bottom reflects so much of the sonar it’s bright and fish show up as bright areas which means there is little contrast and they are easily hidden, while softer bottoms show up darker so fish really show up in this image.
Notice all the fish on the right on the first image.

I usually leave my unit on 455 kHz since you get much more range than with 800 kHz.
The next image shows larger fish in the red circle and smaller fish in the green circles. Notice the depth is 3.7 ft.

But don’t be fooled by logs on the bottom left over from the timber logging industry.
Yellow arrows are pointing out the logs.
The red circles are around fish which show up as white dots.
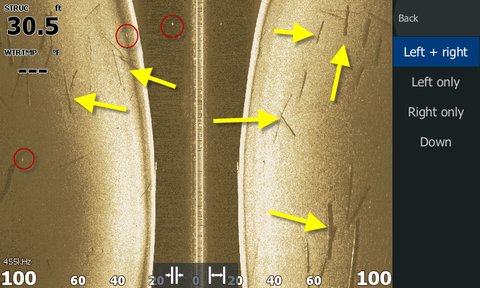
The next image has more fish that are longer. Here we need to remember the length of the fish is dependent on boat speed. The faster the boat travels the fewer sonar pings that are going to cover the fish so their length will show up shorter.
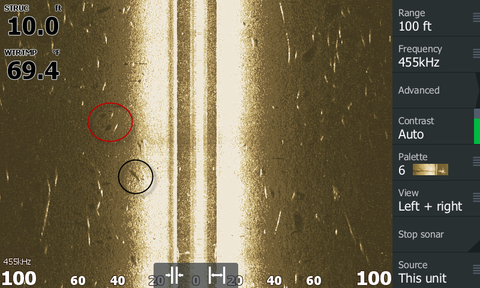
Another good way for identifying fish is the shadow the fish cast, the farther away the shadow is from the fish the higher in the water column the fish is located.
The red and black circles show fish and shadows. The fish nearer the center are harder to see since the bottom is brighter nearer the center so the shadow becomes helpful in identifying the fish.
I finally got to play around with the new Lowrance 3D StructureScan and used it to target suspended crappie.
The 3D display works like side can but now you can see where the fish are suspended in the water column. With side scan you can only see the fish are off to the side not where they are in the water column.
This image shows the prop wash bubbles (red circle) and the crappies suspended on the left side (green arrow).

The next image shows the crappies as history as I drive back to them. The red arrows show the prop wash bubbles and the green arrows different schools of crappie. You can rotate the screen to give these different views of the 3D live. So far I have only found it useful for suspended fish but there will be more crappie tacos for me because of this tool.

Don’t miss supper, get better at sonar and fish where there are fish. Use the splitscreen sonar and down imaging and compare the two and you will become an expert.
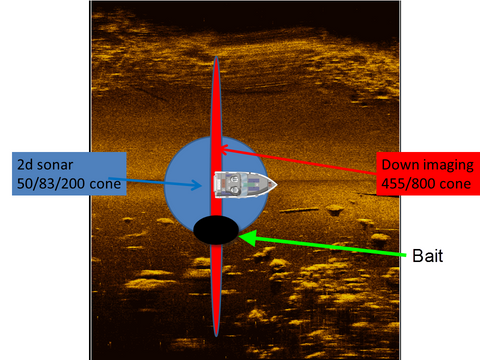
Down imaging has a narrow wide cone and the 2D sonar has a round cone so they view targets differently and comparing the two makes interpreting sonar much easier.
This image is showing trees and the 2D sonar on the left is difficult to interpret but the down imaging shows the trees well.
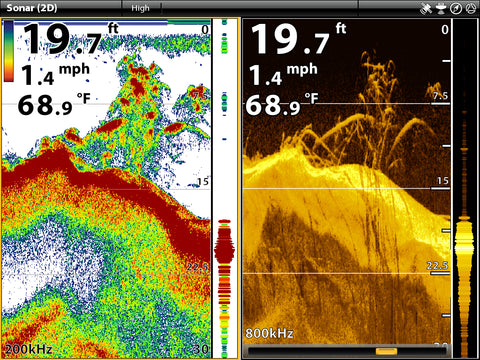
This image shows fish on the side of a boulder but the down imaging shows 2 fish and I get much more excited seeing two fish than one.
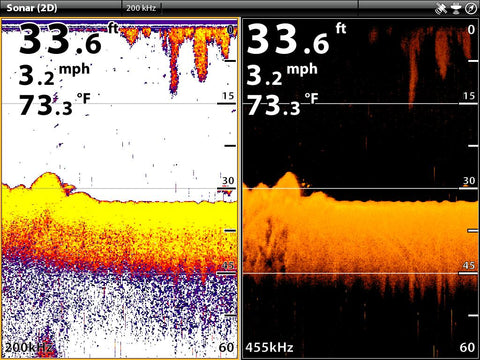
This image shows 2 bait balls in weeds (yellow and green arrows) that the 2D sonar looks like weeds.
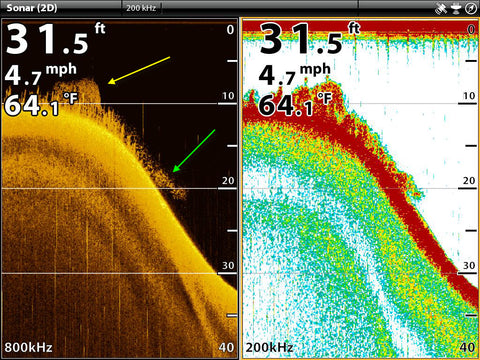
This image looks like stacked fish because of the arches but it is a common when you have posts or trees.
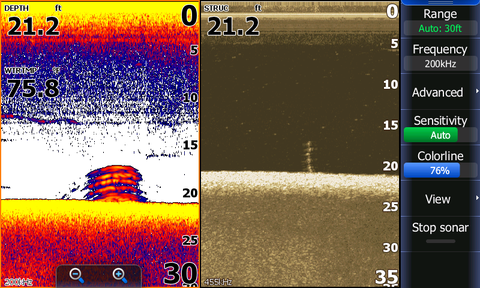
On this image the bait ball and the larger fish near it are missed with 2d sonar.
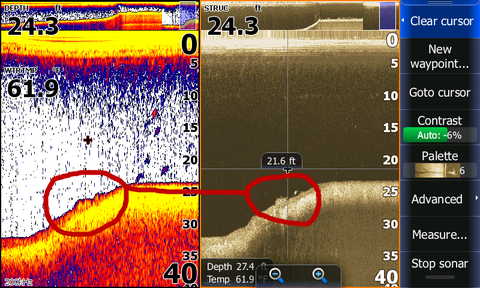
I see images like these everyday on the water since I usually run down imaging with 2d sonar. If you miss a fish on sonar you may miss supper.
We all struggle with interpreting the sonar at times.
For example, this big blue arch can be puzzling when you first see it.

I usually run my sonar in splitscreen with down imaging which often gives me the answer.
The down imaging shows the blue arch as a bait ball.
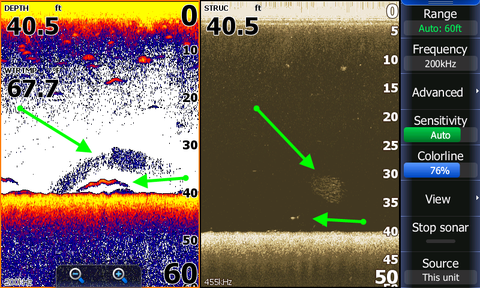
Since the blue arch is unusually shaped and blue and not dense I conclude it is the bait on the edge of the 2D cone. I bet the bait was located near the black circle in the below image. The wider cone of the down imaging shows the bait better.
